Sonic Visualiser is an application for viewing, analyzing, and annotating audio files. It was developed at the Centre for Digital Music, Queen Mary, University of London and is available at: https://sonicvisualiser.org. This is a short guide to get you started quickly with the application.
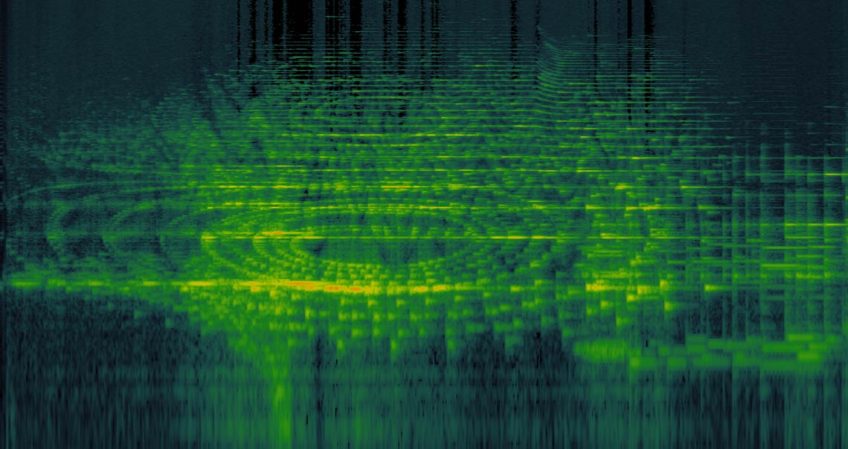
The spectrogram above is from the beginning of Vowel (2008).
Visualize an audio file
Launch Sonic Visualiser, and open the audio file you want to analyze:
Cmd-o
Add a spectrogram layer:
Shift-g
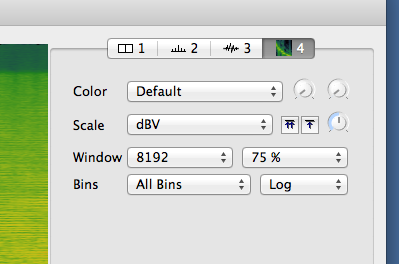
Adjust the FFT settings in Sonic Visualiser (the following is a good starting point, change it according to your needs):
Window:  8192
Window overlap:  75%
Bins:  Log
Zoom in and out on the spectrogram:
Up and down arrows
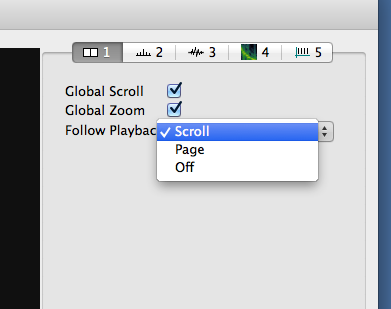
Make the screen scroll when you hit play:
Select layer 1-->open the “Follow Playback” drop-down menu-->select “Scroll”
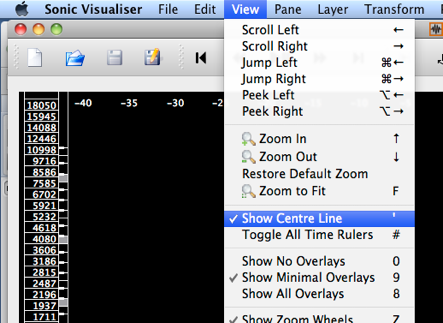
Show the center line (i.e., show the audio playback position line):
Open the “View” drop-down menu-->select “Show Centre Line”
Annotating the visualization
Create a time instant (which appears as a vertical line; for example, to delineate a section of an audio file):
Put the center line on the desired position on the spectrogram
Add a “time instant” by pressing semi-colon (“;”) or by clicking with the pencil tool
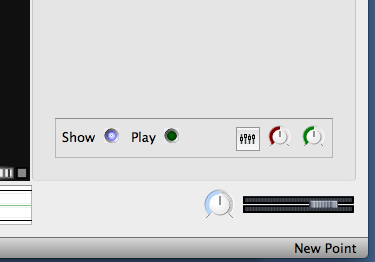
While still in the time instants layer you can do the following:
- Re-name the time instant by using the edit tool (double-click on the line you wish to re-name with the Cartesian-coordinate-shaped tool to bring up a dialog box)
- Toggle the “Play” button (in the lower right hand corner) to ensure the time instant doesn’t make a sound (time instants normally make a little click sound when you hit play and your audio position line passes over them)
Put a text box on the spectrogram (for example, to label an important element in the spectrogram):
Add a new text layer by pressing the key “t”
Use the pencil tool to insert a text box
Enter a label, press OK
Use the edit tool (the Cartesian-coordinate-shaped tool) to change or move the text box
Note that you can have multiple time instants layers and multiple text layers, each with different colors. There are also other types of layers that are not covered in this quick guide.
Export the entire spectrogram as an image file:
File-->Export Image File...-->name it-->press Save-->select: “Export whole pane”
Leave a Reply